Worksheet directions
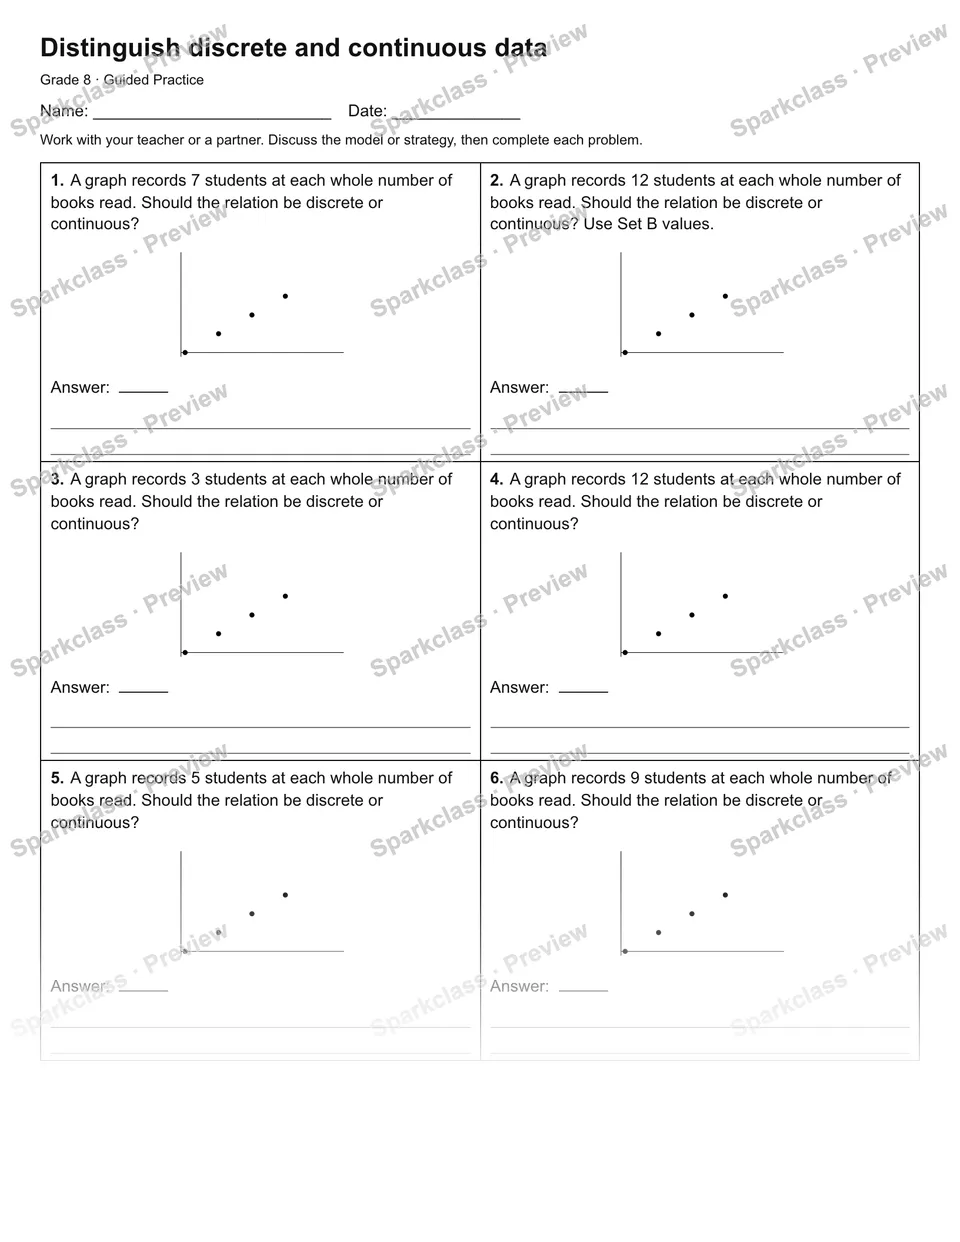
Grade 8 • Guided Practice • Work with your teacher or a partner. Discuss the model or strategy, then complete each problem.
Sample questions
- A graph records 7 students at each whole number of books read. Should the relation be discrete or continuous?
Answer: ___
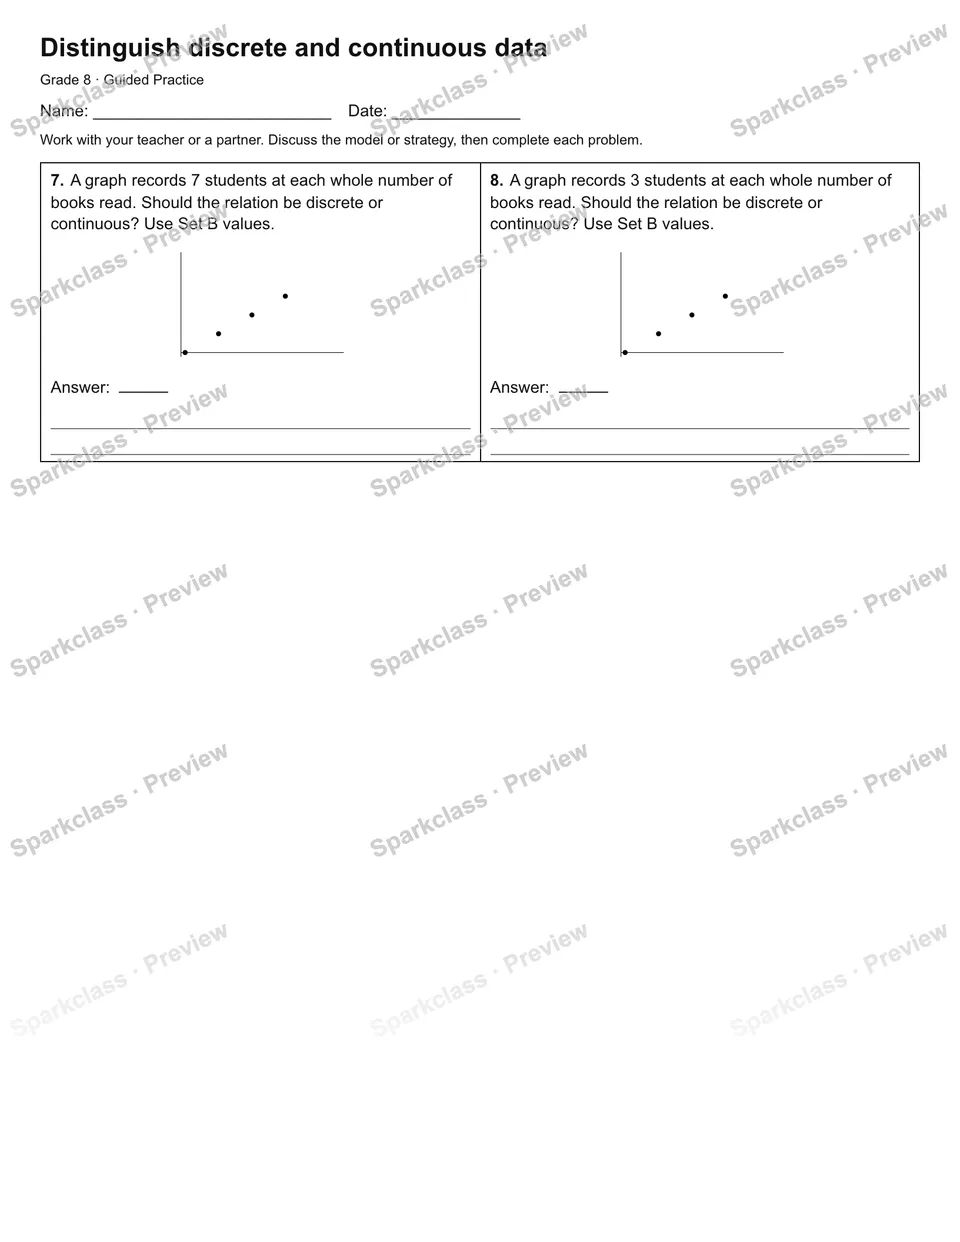
- A graph records 12 students at each whole number of books read. Should the relation be discrete or continuous? Use Set B values.
Answer: ___
- A graph records 3 students at each whole number of books read. Should the relation be discrete or continuous?
Answer: ___
- A graph records 12 students at each whole number of books read. Should the relation be discrete or continuous?
Answer: ___
- A graph records 5 students at each whole number of books read. Should the relation be discrete or continuous?
Answer: ___
- A graph records 9 students at each whole number of books read. Should the relation be discrete or continuous?
Answer: ___
See the preview for diagrams, answer spaces, and the complete layout.
Common Core connections
Source labels: 8.F.A.1–3. Review the learning goals below to check the fit for your class.
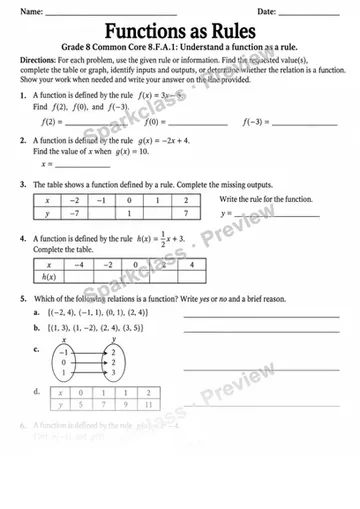
- 8.F.A.1 — Understand a function as a rule
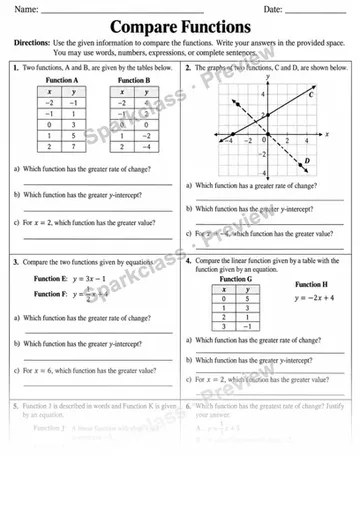
- 8.F.A.2 — Compare two functions across representations
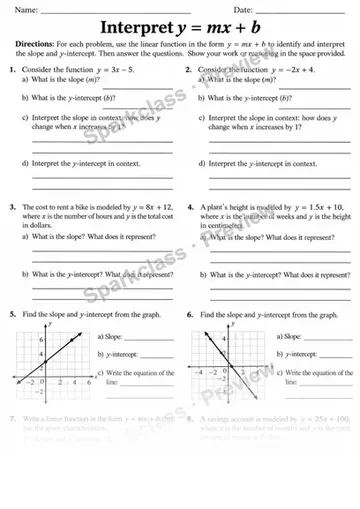
- 8.F.A.3 — Interpret y = mx + b as a linear function
Bring it into your lesson
Open this worksheet in Sparkclass to copy it to your Files. Check the resulting layout before sharing it with students.
Open in Sparkclass →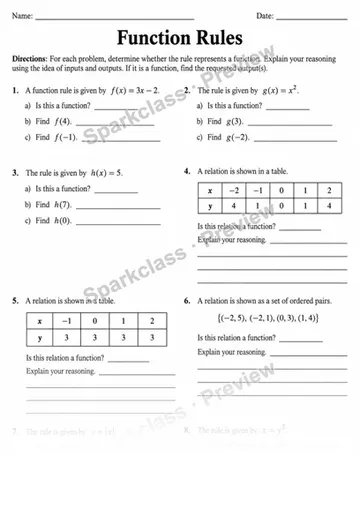 1 pages
 1 pages
 1 pages
 1 pages