Worksheet directions
Grade 8 • Review • Choose a strategy for each problem. Explain or check your thinking where requested.
Sample questions
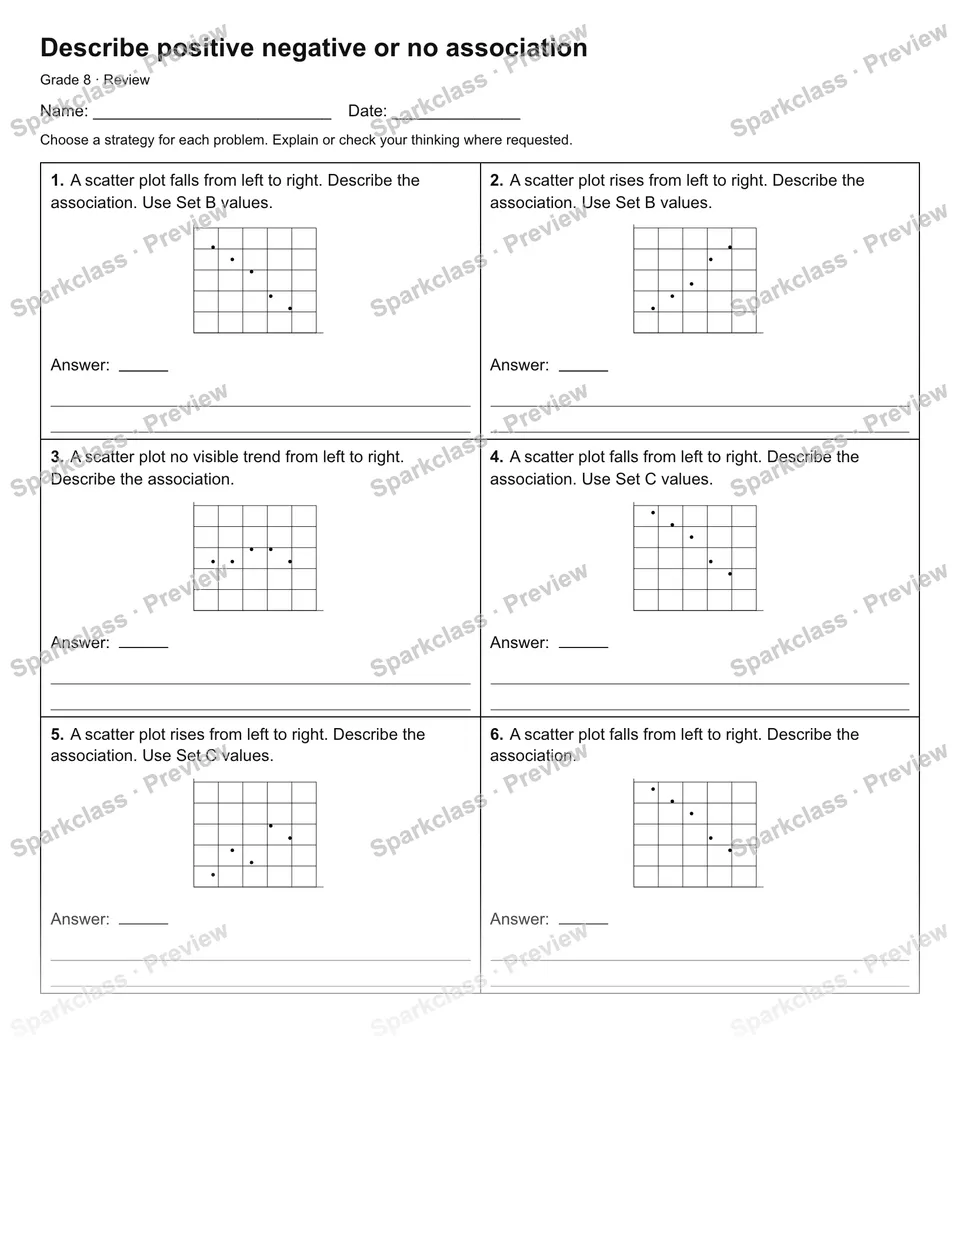
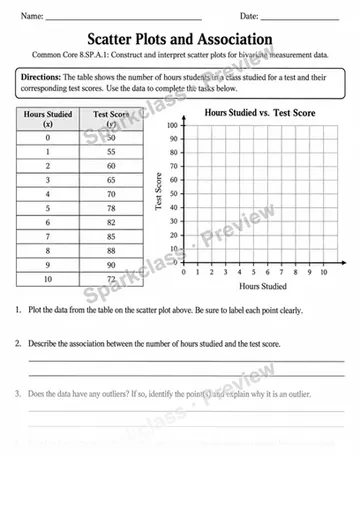
- A scatter plot falls from left to right. Describe the association. Use Set B values.
Answer: ___
- A scatter plot rises from left to right. Describe the association. Use Set B values.
Answer: ___
- A scatter plot no visible trend from left to right. Describe the association.
Answer: ___
- A scatter plot falls from left to right. Describe the association. Use Set C values.
Answer: ___
- A scatter plot rises from left to right. Describe the association. Use Set C values.
Answer: ___
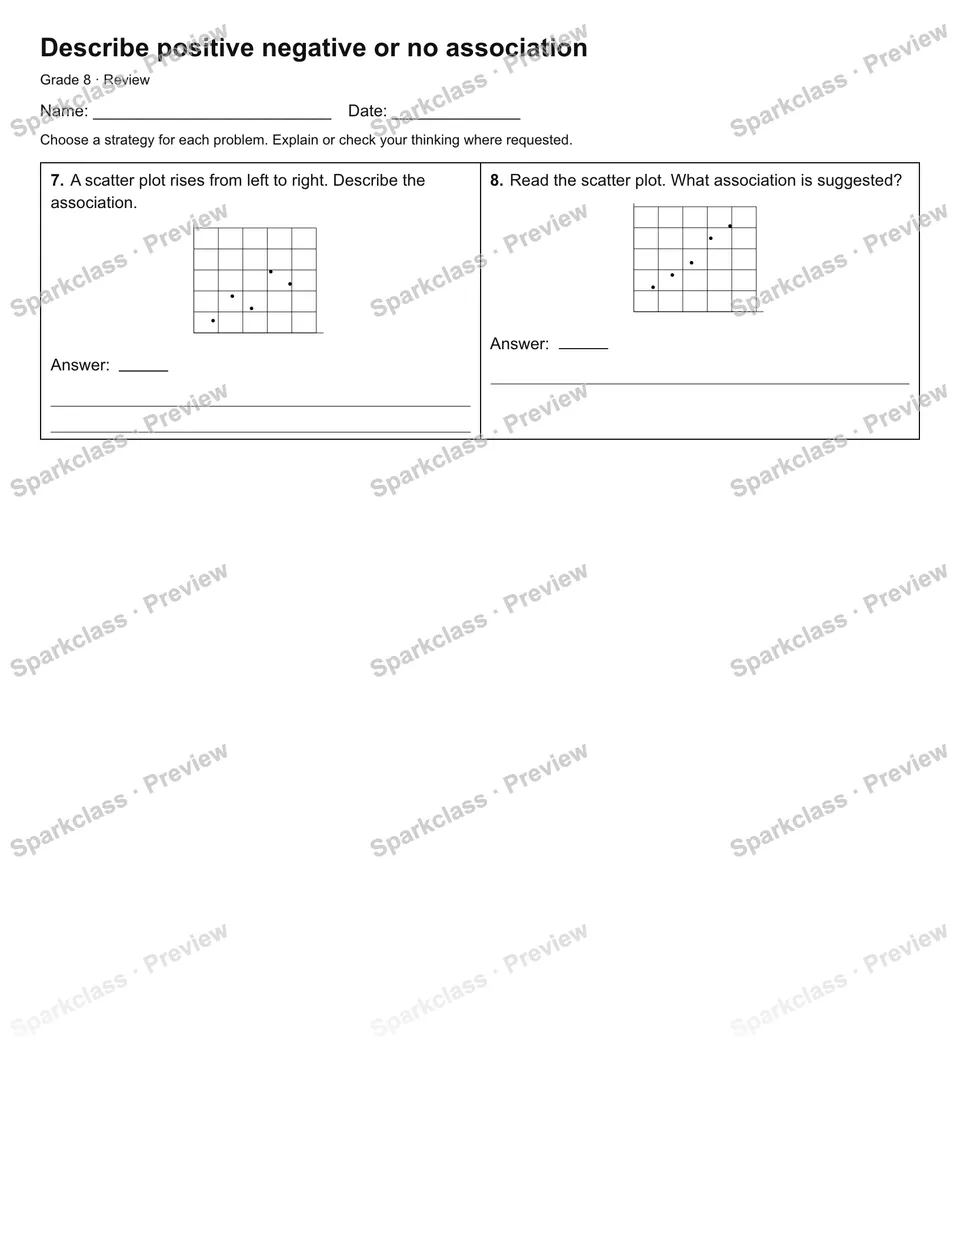
- A scatter plot falls from left to right. Describe the association.
Answer: ___
See the preview for diagrams, answer spaces, and the complete layout.
Common Core connections
Source labels: 8.SP.A.1–4. Review the learning goals below to check the fit for your class.
- 8.SP.A.1 — Construct and interpret scatter plots
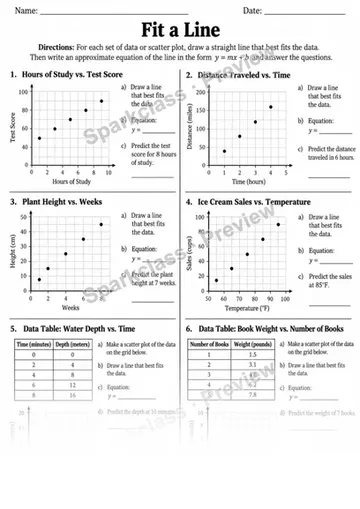
- 8.SP.A.2 — Fit a straight line to scatter plot data
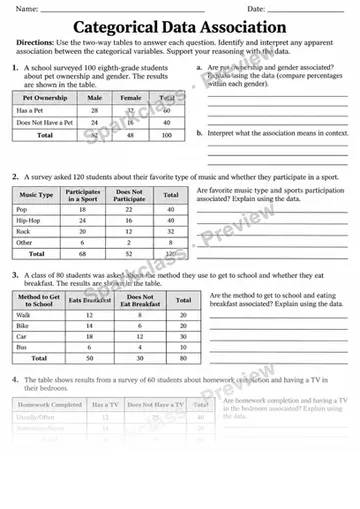
- 8.SP.A.4 — Patterns of association in categorical data
Bring it into your lesson
Open this worksheet in Sparkclass to copy it to your Files. Check the resulting layout before sharing it with students.
Open in Sparkclass → 1 pages
 1 pages
 1 pages
 1 pages