Worksheet directions
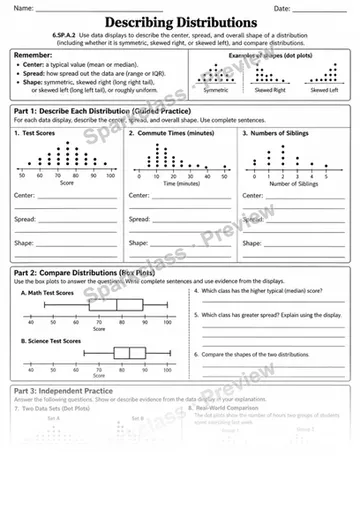
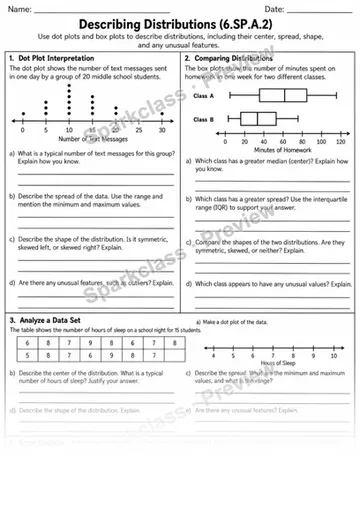
Grade 6 • Homework • Use the strategies practiced in class. Show your work and check your answers.
Sample questions
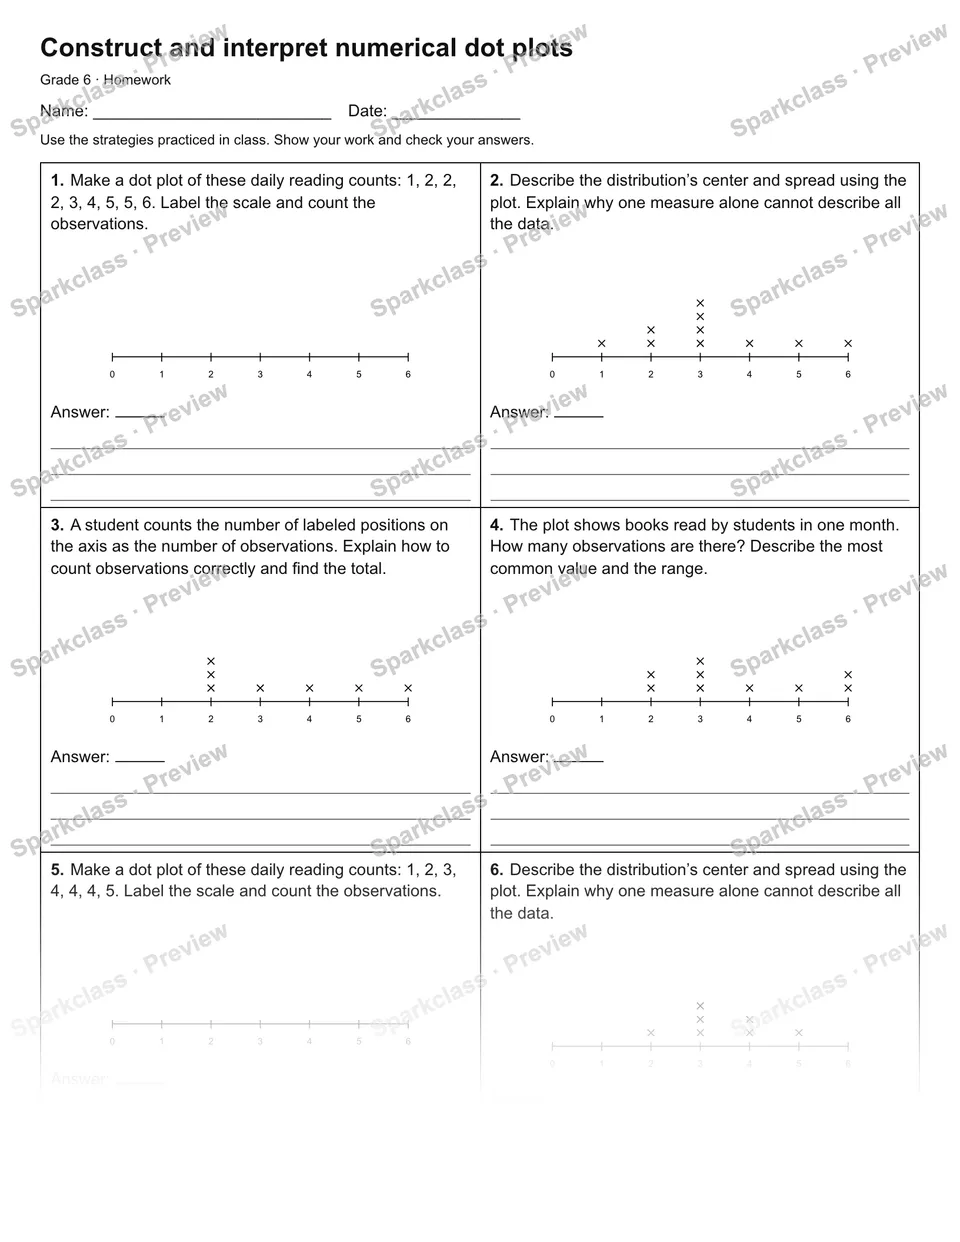
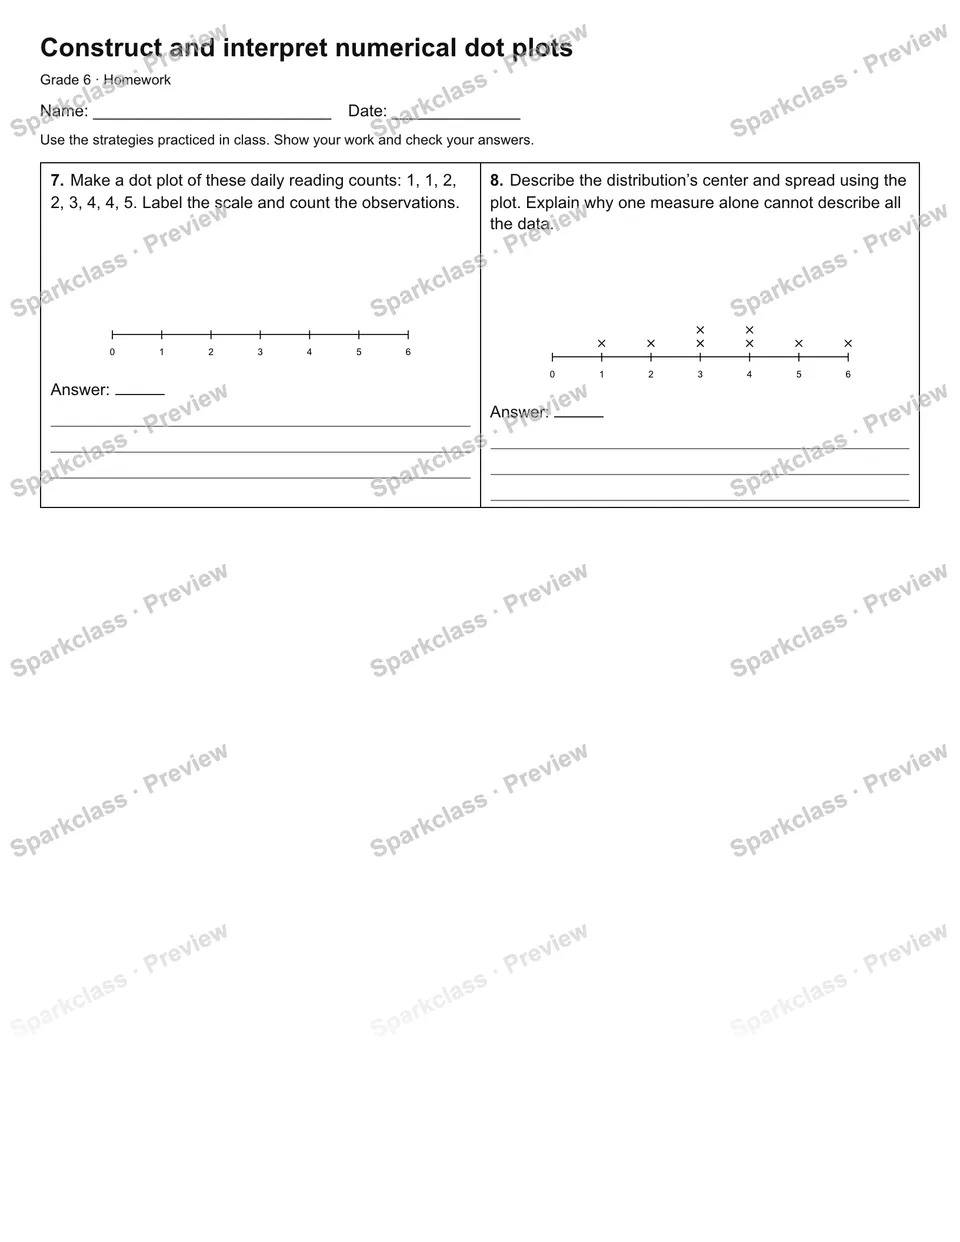
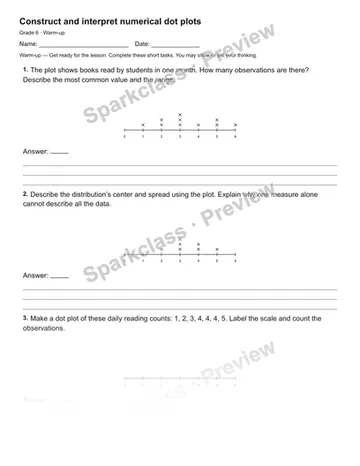
- Make a dot plot of these daily reading counts: 1, 2, 2, 2, 3, 4, 5, 5, 6. Label the scale and count the observations.
- Describe the distribution’s center and spread using the plot. Explain why one measure alone cannot describe all the data.
- A student counts the number of labeled positions on the axis as the number of observations. Explain how to count observations correctly and find the total.
- The plot shows books read by students in one month. How many observations are there? Describe the most common value and the range.
- Make a dot plot of these daily reading counts: 1, 2, 3, 4, 4, 4, 5. Label the scale and count the observations.
See the preview for diagrams, answer spaces, and the complete layout.
Common Core connections
Source labels: 6.SP.A.2, 6.SP.B.4–5b. Review the learning goals below to check the fit for your class.
Bring it into your lesson
Open this worksheet in Sparkclass to copy it to your Files. Check the resulting layout before sharing it with students.
Open in Sparkclass →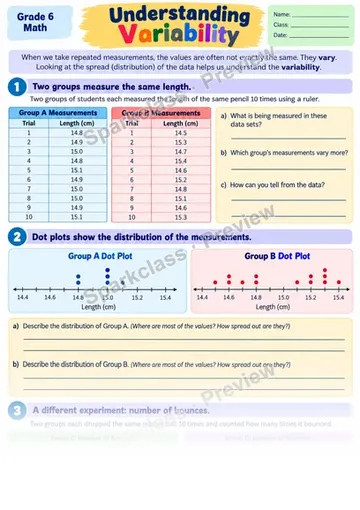 1 pages