Interpret a scaled picture or bar graph — Exit Ticket — page 1
Page 1 / 2
Interpret a scaled picture or bar graph — Exit Ticket — page 2
Page 2 / 2

Worksheet directions

Grade 3 • Exit Ticket • Two identical copies. Cut along the dashed line.

Sample questions

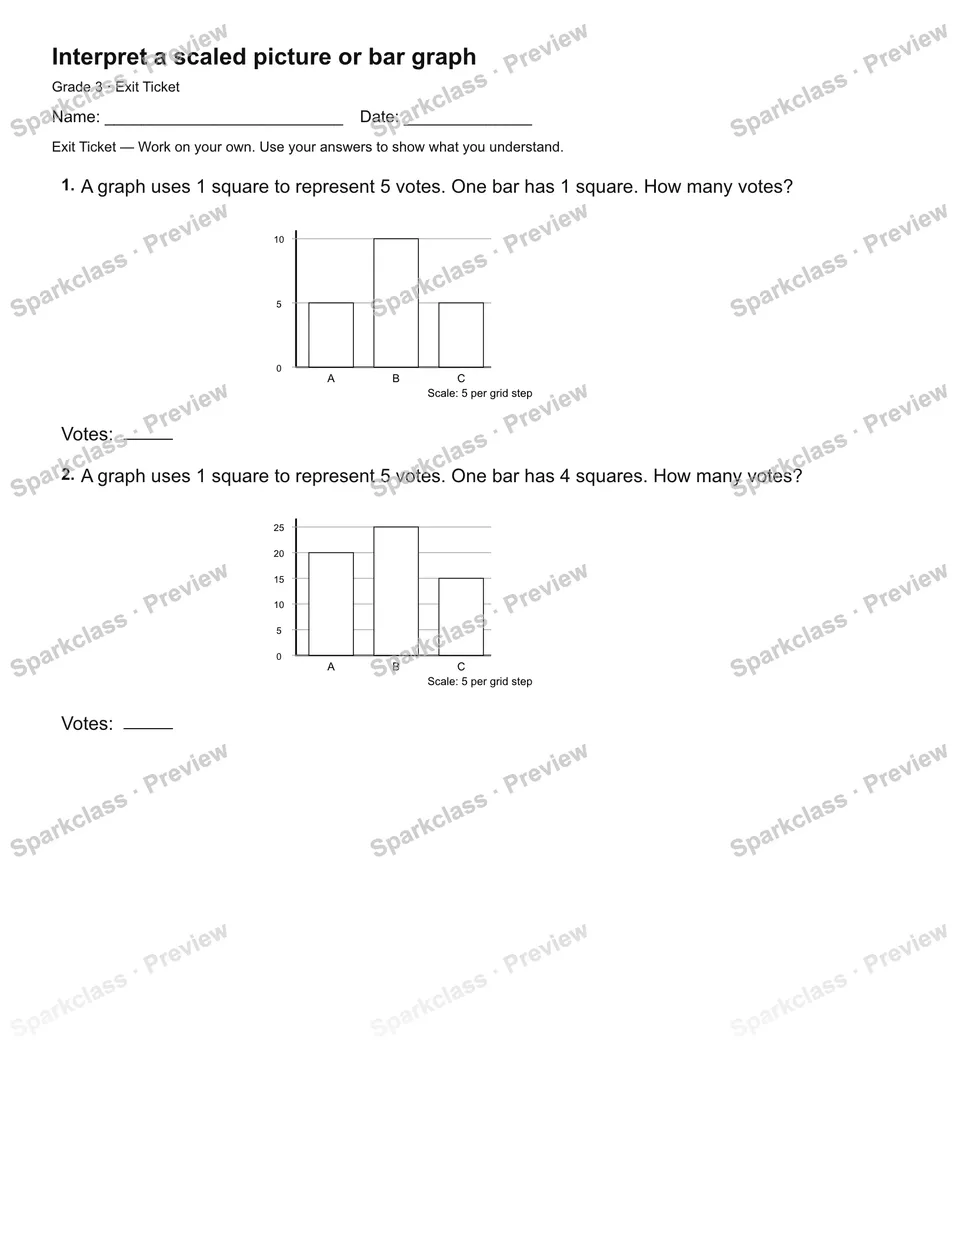
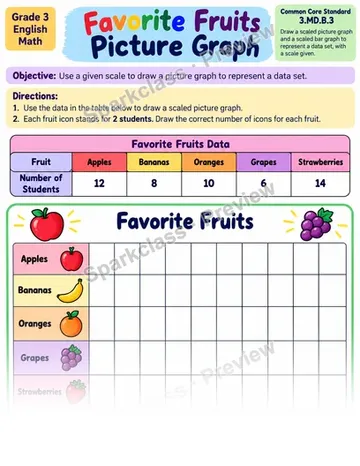
  1. A graph uses 1 square to represent 5 votes. One bar has 1 square. How many votes? Votes: ___
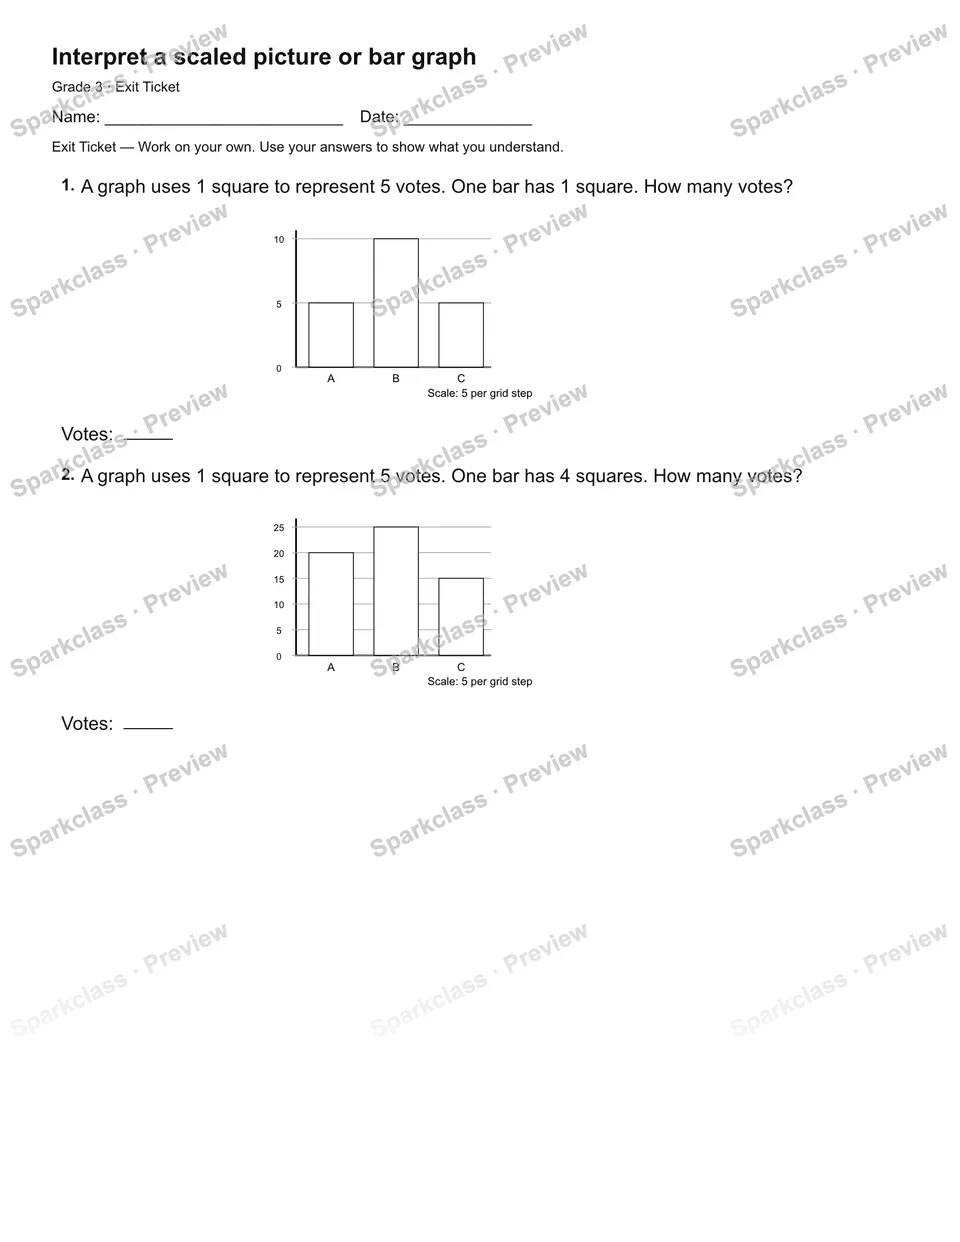
  2. A graph uses 1 square to represent 5 votes. One bar has 4 squares. How many votes? Votes: ___

See the preview for diagrams, answer spaces, and the complete layout.

Common Core connections

Source labels: 3.MD.B.3, 3.MD.B.4. Review the learning goals below to check the fit for your class.

  • 3.MD.B.3 — Draw scaled picture and bar graphs
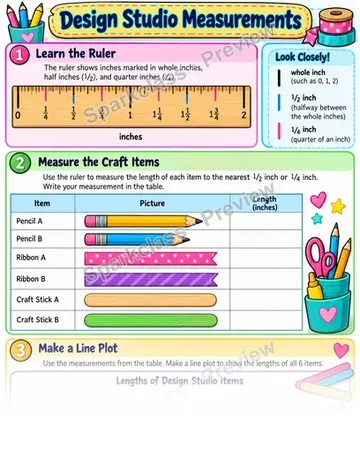
  • 3.MD.B.4 — Line plot in halves and fourths

Bring it into your lesson

Open this worksheet in Sparkclass to copy it to your Files. Check the resulting layout before sharing it with students.

Open in Sparkclass →
More practice for this learning goal